
Let’s start this discussion with troubleshooting networks. I’m not sure about you, but I need a network drawing to troubleshoot; it’s the only way I can keep things straight. I have seen many people scribble little drawings on paper as they run commands on each device in the network, but while these drawings make sense to them at the time, they are difficult to understand after the fact. Creating the drawing was ultimately a waste of time, as it can’t be reused.
Having an up-to-date drawing will save time when troubleshooting network issues. These are the three topology types we use to troubleshoot networks:
1. Physical Topology
The Physical Topology is a map of your network devices and their connections. It includes physical devices and interfaces, and there is no virtualization involved. With the aid of a Physical Drawing, you can disconnect and reconnect all cables between network devices.
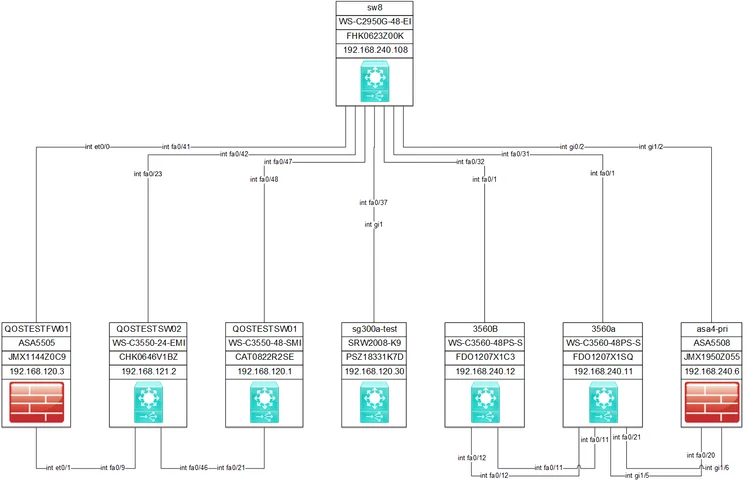
You can display Layer 2 VLANs on a Physical Topology Map, which helps illustrate the VLAN domains across the switches. There are scenarios when you would not see a VLAN on a physical interface, such as when the interface is configured as part of a virtual interface, i.e., a Port-Channel or aggregated interface. These interfaces assume the responsibilities of the Physical interface for Layer 2 traffic. In the following image, call-out #1 shows a physical representation of a virtualized device and call-out #2 shows a physical representation of two physical interfaces. These physical representations will be shown virtually on the next Topology type, the vPhysical.
2. vPhysical Topology
The vPhysical Topology includes physical devices and virtual representations of physical devices. The Cisco ASA and the Cisco Nexus 7k are examples of devices that can be virtualized physically. The ASA uses Security Context, and the Nexus 7k uses Virtual Device Context. The vPhysical Topology contains Physical Interfaces and Virtual Layer 2 Interfaces. Layer 2 VLANs are also displayed. The vPhysical allows you to visualize the virtual path through your physical environment.
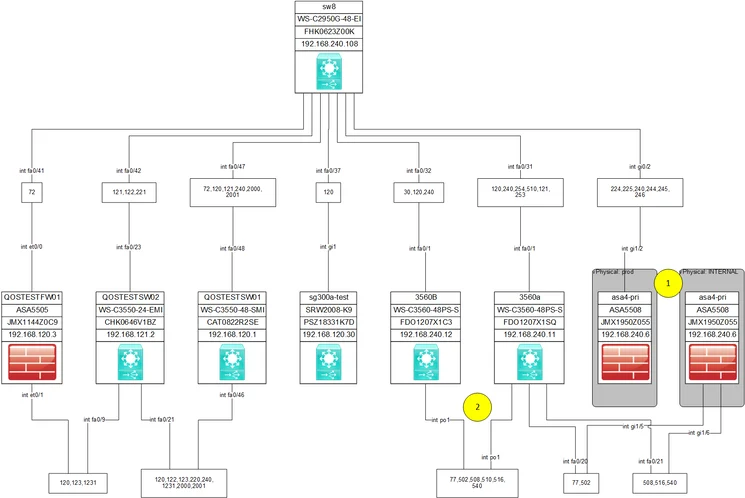
You may be unfamiliar with the vPhysical concept. It is a Topology type used in bitB Dynamic Mapping Software. We created the concept when hardware and interface virtualizations became popular and the Physical path could no longer be easily shown with a Physical Topology map, creating the need to show a virtual path through the network. For example, if a Firewall was virtualized physically, then one Physical interface could be used in two different Security Contexts. If you did not show the breakout of the context, then you would not have a true picture of the packet flow through the multiple security contexts. This is shown in the following image. Call-out #1 shows a virtual representation of the Physical device shown in the Physical Topology. Now you see two Security Context on the Cisco ASA firewall. The prod and Internal contexts. Call-out #2 shows something similar. A virtual representation of the physical interfaces is shown as one virtualized interface. In this case, the virtualized interface is a Cisco Port-Channel, Port-Channel1.
3. Logical Topology
The Logical Topology primarily includes Layer 3 devices. It may include some Layer 2 devices if the subnet is shown for the device’s management IP address. We recommend excluding the management subnets from your standard Logical Topology maps. It is better to create a dedicated administrative or management network topology map and display them there. The Logical representation will allow you to easily follow the flow of traffic through the network.
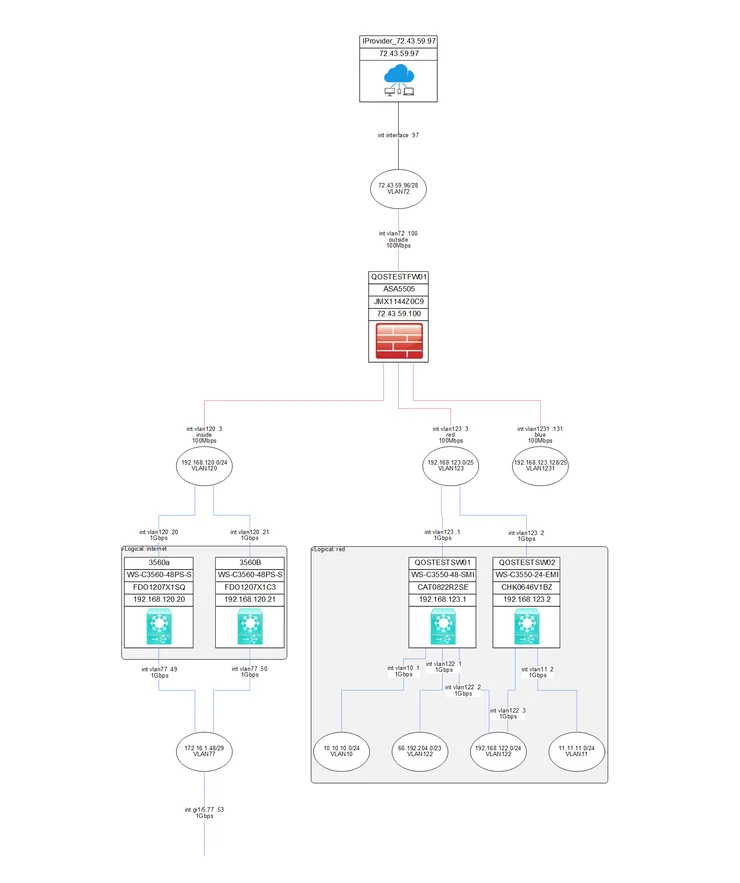
Layout Themes
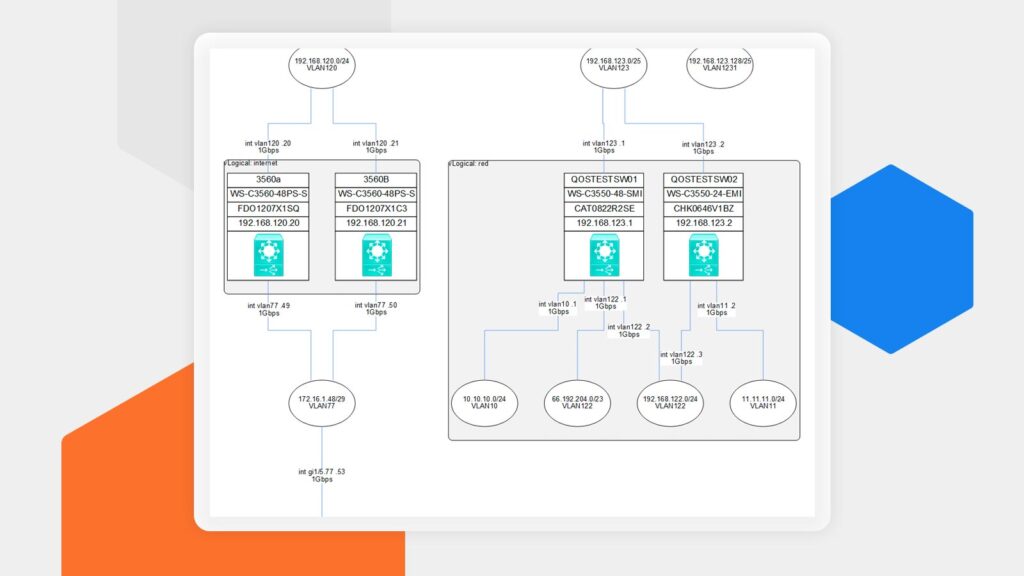
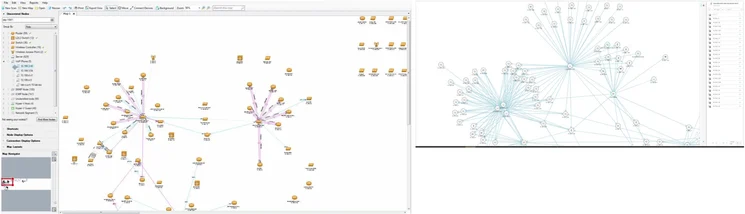
bitB has two layout themes for the Logical Topology. The first is All Subnets – Internet Driven, which shows all Layer 3 subnets connected to each device that was selected for the drawing. This is useful if you want to know which devices are connected to which subnets. If you’re troubleshooting the network, however, it is helpful to only show the interconnect subnets. Interconnect subnets connect two network devices together, and they are used to create the path through the network, as pictured here. The drawing on the left shows all subnets, and the drawing on the right shows only interconnect subnets. The drawing on the right allows better focus in troubleshooting issues.
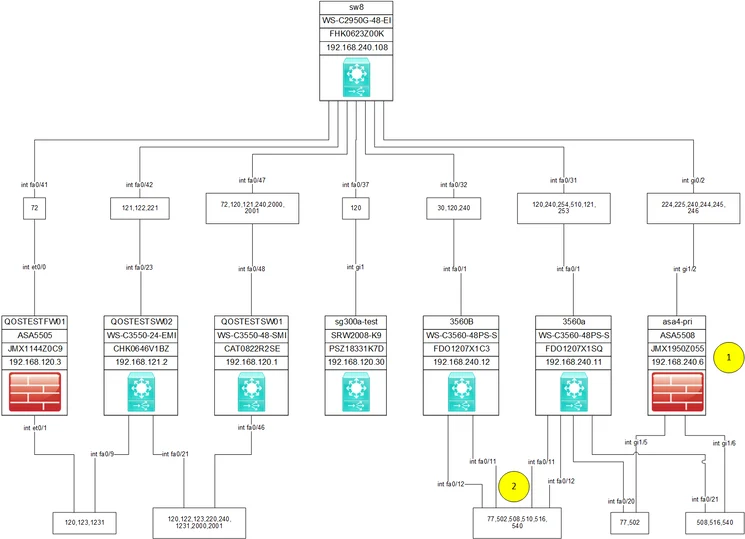
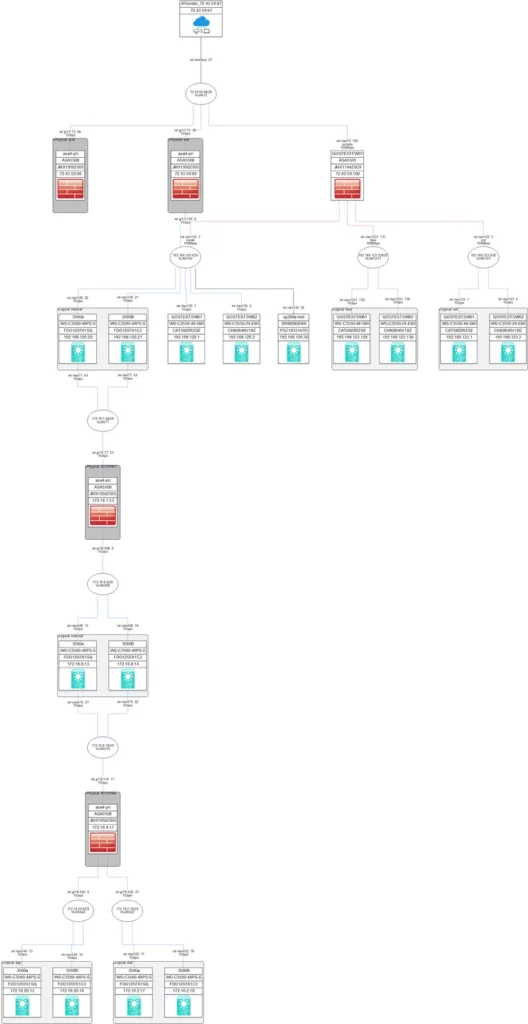
bitB does this differently by using a Route-Driven Hierarchical layout. The devices appear in a layered hierarchy based on where they are located in the route path from the Internet to the internal network. The device closest to the Internet appears at the top of the topology, and each hop into the internal network is displayed below the previous device. Therefore, you see exactly how the network devices switch and route traffic through the network.
Creating an accurate topology for your network now will save you a lot of headaches when issues arise in the future, allowing you to troubleshoot more efficiently and effectively than if you tried to follow those old, illegible scribbles you made on a whim.